
Broad situational awareness
A regional overview of where heat and smoke are being detected, day and night, with a clear indication of how recent the latest image is.
- Live mode
- Hotspots 24 h
- Full screen
Near real-time · Himawari-9 · Nationwide
Satellite imagery of the whole continent, processed into five fire-focused composites, detected hotspots and nearby exposure — in a web mapping app and through API.
Questions about using the app or data? Please contact us.
Australia is the driest inhabited continent and highly vulnerable to climate change. BigData Earth brings many years of bushfire observation from space, together with fire hazard, exposure and risk modelling, to help gain a timely, big-picture view of major bushfires across the country.
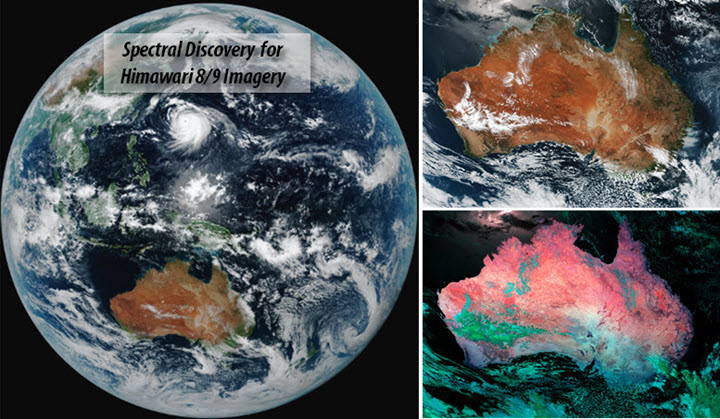
Our Spectral Discovery software processes imagery from Japan’s geostationary Himawari-8/9 satellites, which scan Australia every 10 minutes. Rapid band combinations, adaptive stretching and image fusion produce five composites — natural colour, vegetation, burnt areas, hotspots and thermal anomalies — published as map tiles in under 20 minutes. Read the mapping study
To detect hotspots we combine neural-network models with threshold selection, and compared results with 10–15 m Sentinel-2 and Landsat-8 imagery on extreme fire-weather days of the 2019–20 Black Summer. At ~2 km resolution, composite images suit public warning best, while extracted hotspot features support exposure and risk analysis. Read the hotspot study
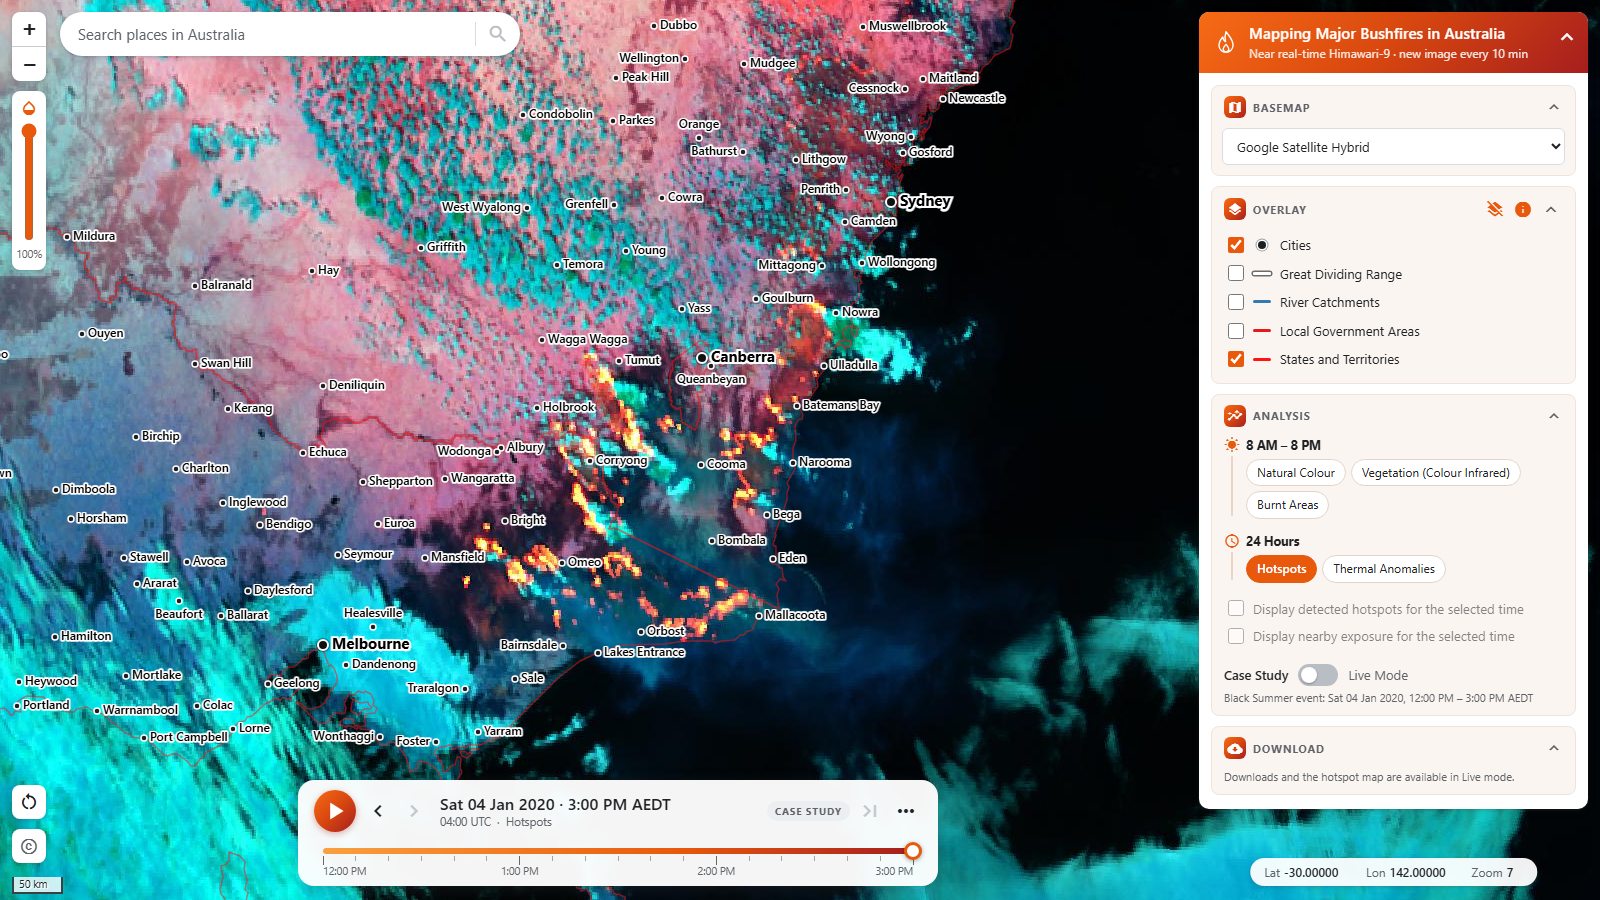
A full-screen web map that puts the latest Himawari-9 image, detected hotspots and the addresses near them in one view. It reads clearly on a wall display and is light enough for a tablet in the truck. Nothing to install: open it in a browser.
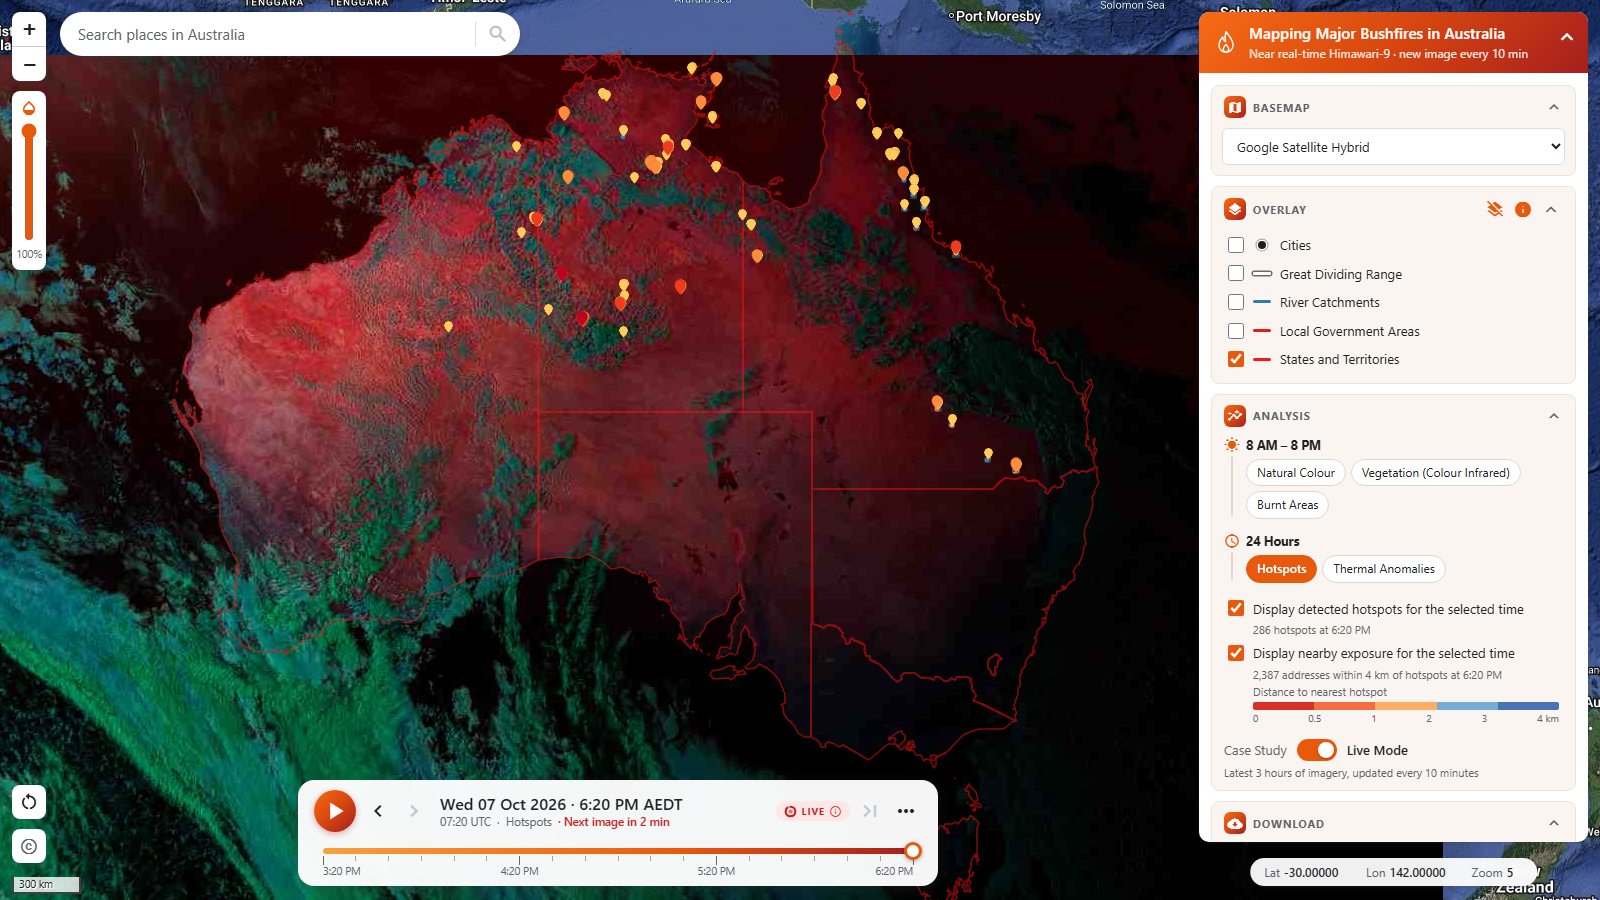
Live mode · Wed 7 Oct 2026, 6:20 PM AEDT. Tap a number to see what each control does.
Search towns and localities across Australia. The imagery opacity slider sits under the zoom buttons.
Pins coloured by brightness temperature. Click one for its time, temperature and fire-pixel confidence.
Daytime styles for smoke and burn scars; 24-hour styles for heat, including overnight runs.
Turn on the addresses near detected hotspots, coloured by distance to the nearest one.
Play back fire spread, step frame by frame and set the speed. AEDT/AEST is handled automatically.
The LIVE badge counts down to the next image and turns amber if the feed is delayed.
Broad-scale context from ~2 km imagery, alongside local information
A regional overview of where heat and smoke are being detected, day and night, with a clear indication of how recent the latest image is.
Follow the general development of larger fires over recent hours, see the broad extent and drift of smoke, and gauge how many addresses lie near detected hotspots.
Opens in a web browser on a tablet or phone, with compact image tiles for patchy coverage and place search to jump to a locality.
Indicate the general extent of burnt areas, download imagery and hotspot layers for any frame, and replay past events for training, research and review.
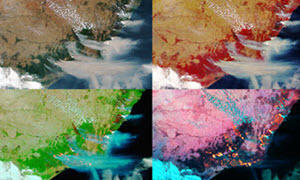
Himawari composites, south-east Australia, Sat 4 Jan 2020, 2:00 PM AEDT
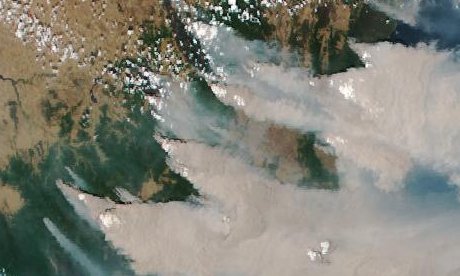 Daytime
Smoke plumes: their extent, drift and direction.
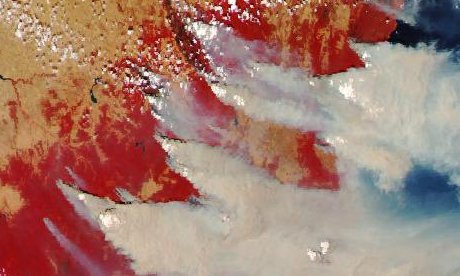 Daytime
Healthy vegetation in red, for fuel and landscape context.
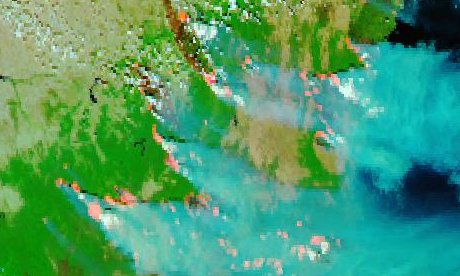 Daytime
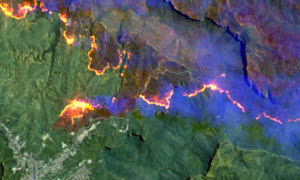
Fresh burn scars and the edges of fire grounds.
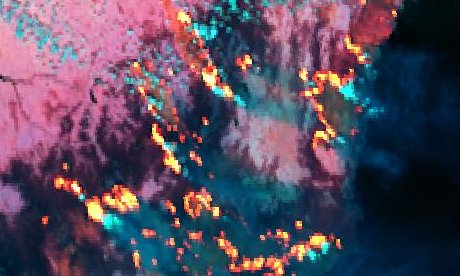 24 hours
Active fire fronts glow yellow-orange, day and night.
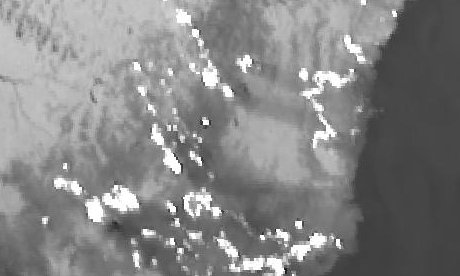 24 hours
The raw heat signal, through thin smoke and after dark.
No install, no plug-ins
The latest three hours of imagery, a new frame every 10 minutes.
Replay Black Summer, 4 Jan 2020, for training and review.
Pins classed by Band 7 brightness temperature, with popups.
G-NAF addresses near hotspots, coloured by distance.
Play, pause, step and set speed; local daylight-saving handled.
Cities, Great Dividing Range, catchments, LGAs and states.
Place search, opacity control, satellite, terrain or street basemaps.
Level 1–3 products for the selected frame.
Agencies, councils, utilities, insurers, media and researchers, or anyone wanting to build the maps and data into their own systems: please contact us to discuss your needs and API access.
Every Himawari-9 image is processed into four product levels, from map tiles ready for your common operating picture to the addresses near each hotspot. All levels are available by API key.
Ready-to-display tile layers in all five composite styles, published nationwide every 10 minutes.
tileset1 natural · tileset2 vegetation · tileset3 burnt · tileset4 hotspots · tileset7 thermal/h9/{year}/{month}/{day}/{hhmm}/{tileset}/{z}/{x}/{y}.jpgcurl -o tile.jpg https://api.RiskMapping.com.au/h9/2026/10/07/0140/tileset4/6/58/38.jpg \ -H "apikey: YOUR_API_KEY" # or with the key in the URL https://api.RiskMapping.com.au/h9/2026/10/07/0140/tileset4/6/58/38.jpg?&apikey=YOUR_API_KEY
# QGIS: Browser panel → XYZ Tiles → New Connection → URL  (min zoom 5, max zoom 7)
https://api.RiskMapping.com.au/h9/2026/10/07/0140/tileset4/{z}/{x}/{y}.jpg?&apikey=YOUR_API_KEY

# ArcGIS Online: Add layer from URL → Tile layer
https://api.RiskMapping.com.au/h9/2026/10/07/0140/tileset4/{level}/{col}/{row}.jpg?&apikey=YOUR_API_KEY
L.tileLayer(
  'https://api.RiskMapping.com.au/h9/2026/10/07/0140/tileset4/{z}/{x}/{y}.jpg?&apikey=YOUR_API_KEY',
  { minZoom: 5, maxNativeZoom: 7, opacity: 0.85,
    attribution: 'Himawari-9 (JMA) | BigData Earth' }
).addTo(map);
Georeferenced composites of the whole country, ready for GIS, remote-sensing and machine-learning workflows.
HS_H09_{YYYYMMDD}_{hhmm}_RGB{n} n = 1, 2, 3, 4, 7/h9/{year}/{month}/{day}/{hhmm}/{image-id}.tif# Hotspots composite (RGB4), 01:40 UTC 7 Oct 2026 curl -o HS_H09_20261007_0140_RGB4.tif \ "https://api.RiskMapping.com.au/h9/2026/10/07/0140/HS_H09_20261007_0140_RGB4.tif?&apikey=YOUR_API_KEY"
https://api.RiskMapping.com.au/h9/{year}/{month}/{day}/{hhmm}/{image-id}.tif?&apikey=YOUR_API_KEY

# e.g. natural colour and thermal for the same frame
https://api.RiskMapping.com.au/h9/2026/10/07/0140/HS_H09_20261007_0140_RGB1.tif?&apikey=YOUR_API_KEY
https://api.RiskMapping.com.au/h9/2026/10/07/0140/HS_H09_20261007_0140_RGB7.tif?&apikey=YOUR_API_KEY
Every hotspot detected in an image as a point feature, with time, brightness temperature and fire-pixel confidence.
HS_H09_{YYYYMMDD}_{hhmm}_Hotspots_V1id lat lon obs_time_UTC obs_time_AEDT temperature_K temperature_C confidence_fire_pixel/h9/{year}/{month}/{day}/{hhmm}/{layer-id}.geojsoncurl -o hotspots.geojson \ "https://api.RiskMapping.com.au/h9/2026/10/07/0140/HS_H09_20261007_0140_Hotspots_V1.geojson?&apikey=YOUR_API_KEY"
import requests

AOI = (148.0, -37.8, 150.2, -35.5)   # lon_min, lat_min, lon_max, lat_max
url = "https://api.RiskMapping.com.au/h9/2026/10/07/0140/HS_H09_20261007_0140_Hotspots_V1.geojson"
fc = requests.get(url, params={"apikey": "YOUR_API_KEY"}, timeout=60).json()

inside = [f["properties"] for f in fc["features"]
          if AOI[0] <= f["properties"]["lon"] <= AOI[2] and AOI[1] <= f["properties"]["lat"] <= AOI[3]]
if inside:
    hottest = max(inside, key=lambda p: p["temperature_K"])
    print(f"{len(inside)} hotspots in the area of interest, hottest pixel {hottest['temperature_K']} K at {hottest['obs_time_AEDT']}")
Every address within a set distance of a detected hotspot, with the nearest hotspot’s details and the distance to it.
HS_H09_{YYYYMMDD}_{hhmm}_Hotspots_V1_Addresses_within{metres}mpid address gnaf_confidence near_* (nearest hotspot) dist_mcurl -o exposure.geojson \ "https://api.RiskMapping.com.au/h9/2026/10/07/0140/HS_H09_20261007_0140_Hotspots_V1_Addresses_within4000m.geojson?&apikey=YOUR_API_KEY"
import requests
from collections import Counter

url = ("https://api.RiskMapping.com.au/h9/2026/10/07/0140/"
       "HS_H09_20261007_0140_Hotspots_V1_Addresses_within4000m.geojson")
fc = requests.get(url, params={"apikey": "YOUR_API_KEY"}, timeout=120).json()

near = [f["properties"] for f in fc["features"] if f["properties"]["dist_m"] <= 2000]
by_locality = Counter(p["address"].split(", ")[-3] for p in near)
for locality, n in by_locality.most_common(10):
    print(f"{locality:<24}{n:>6} addresses within 2 km")
Build any request. Times are UTC in 10-minute steps; products appear about 20 minutes after capture.
apikey header, or append ?&apikey= to the URL. Request a key through the enquiry form.Whether you want to use the maps in your organisation, evaluate the API products or have another question, tell us what you need. We reply within one business day.
We work with fire and emergency services, local government, utilities, insurers, media and researchers across Australia.
For usage, API access, pricing or general questions.